
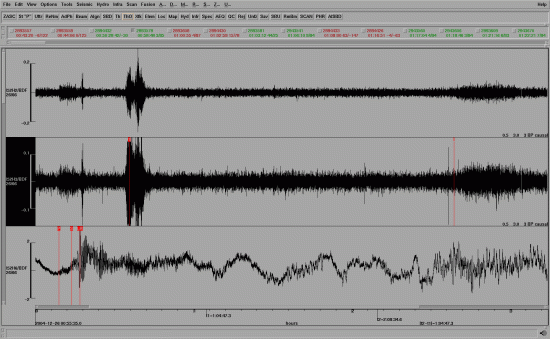
Waveform data processing and analysis
Waveform data are derived from the monitoring of seismic and acoustic waves that move through the Earth, the oceans and the atmosphere, and are recorded by the seismic, hydroacoustic and infrasound stations of the International Monitoring System (IMS). Typically they are displayed as traces across a computer screen, with the x-axis showing time and the y-axis representing the movement of the medium that is monitored, i.e. ground, water or air.
Every single day, many gigabytes of waveform data from the IMS arrive at the International Data Centre (IDC) in Vienna. But without processing, this mass of information would be of little use to most Member States. Quick answers to the most pressing questions are needed. Was an event detected? Where did it take place? How big was it? What characteristics does it display? Was it of natural or human origin?
Targeted processing of monitoring data is needed to give Member States the necessary information to answer these questions and enable them to make decisions concerning the nature of an event.

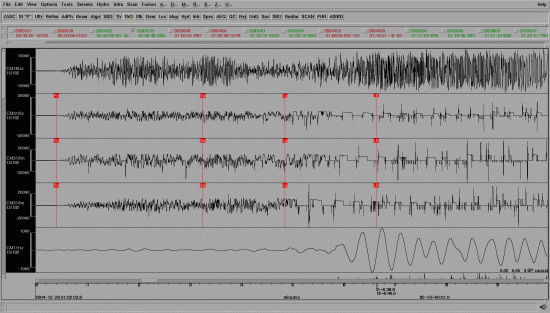
Seismic waves generated by the Indonesian earthquake in December 2004.
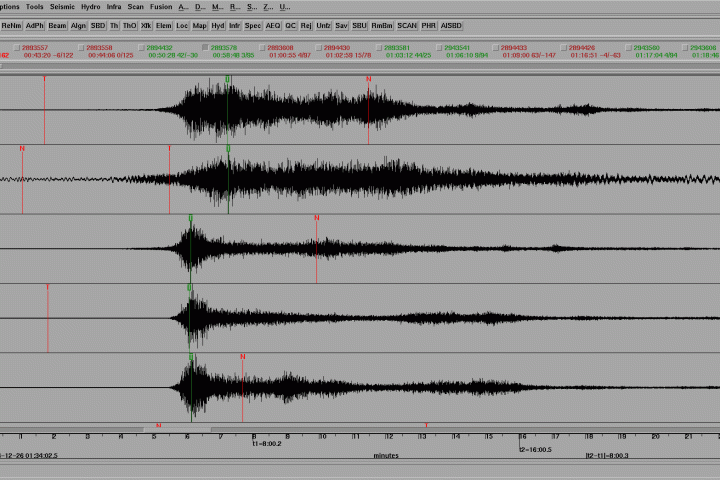
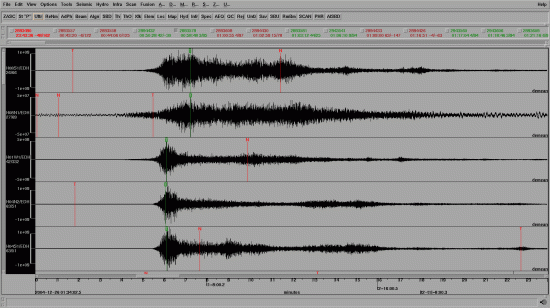
Hydroacoustic waves generated by the Indonesian earthquake in December 2004.
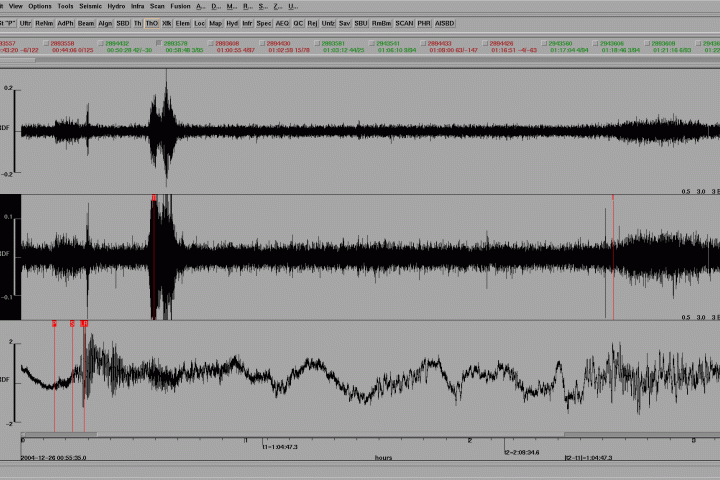
Infrasound waves generated by the Indonesian earthquake in December 2004.
Station processing
Once stored at the IDC, data from each single monitoring station are analyzed individually to detect relevant signals from seismic or acoustic disturbances. This process, called station processing, is entirely automatic.
Once a disturbance is detected, the characteristics of the signals are measured and recorded in a database. These characteristics include time, size and the azimuth, i.e. the direction from which the signal arrived at a station. As with all processing and analysis of data, an important component is to determine the accuracy and reliability of each parameter.
Slightly different methods of automatic processing are used for seismic, infrasound and hydroacoustic data. The principle, however, is the same: to detect any signal that may have originated from a disturbance and could possibly have been a Treaty violation.
Network processing
Typically, an event is recorded at more than one IMS monitoring station. So the next step is to sort out which signals from different stations originate from the same event. This phase, called network processing, is highly complex as there may be many events in the course of a day, including typically more than 100 earthquakes.
By examining all available data and associating them to an event, a clearer picture of what actually occurred begins to emerge, including an estimated location. A good location estimate is important to measure the size of an event, since the size of the signal generally decreases with distance.
Standard Event Lists
This automatic processing results in three consecutive lists of events that are made available to Member States. The first of these lists, Standard Event List 1 (SEL1), is completed within an hour of data being recorded at primary seismic and hydroacoustic stations. At this point, infrasound data are not yet available for processing because the signals travel more slowly through the atmosphere.
Based on the events listed in SEL1, additional data from auxiliary seismic stations are requested to refine the location of events that have already been listed. Requests are formulated automatically and sent to selected auxiliary seismic stations. With this additional information, and with incoming infrasound data, a more comprehensive and higher quality Standard Event List 2 (SEL2) is created within four hours of the first data recording.
The last and most refined of these event lists is Standard Event List 3 (SEL3), which incorporates any additional, late arriving waveform data and is completed within six hours of the first data recording.
This process is entirely automatic, carried out by specially designed computer programs. Up to this point, there has been no human intervention in the data processing.
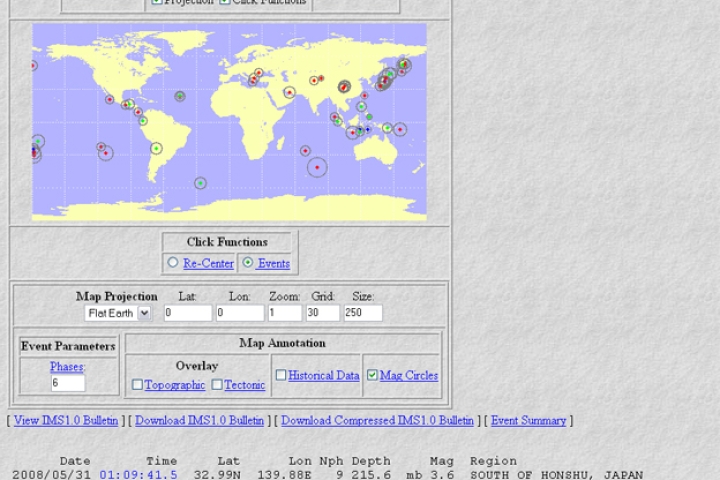
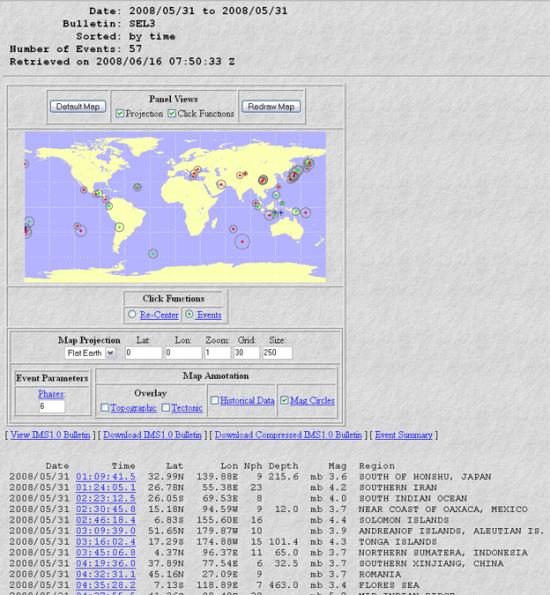
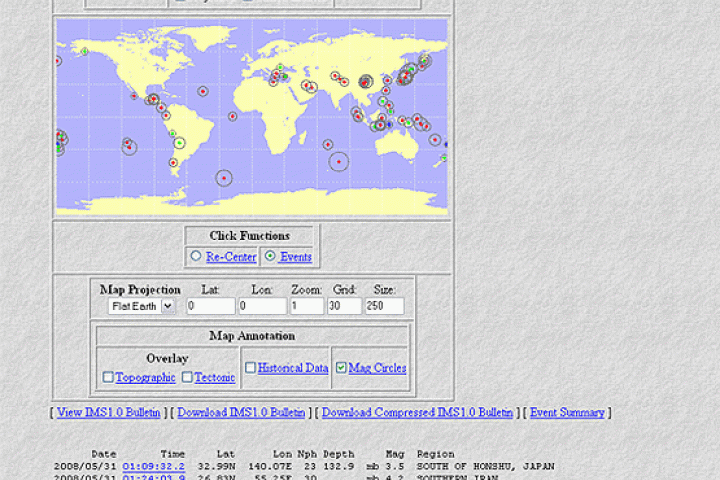
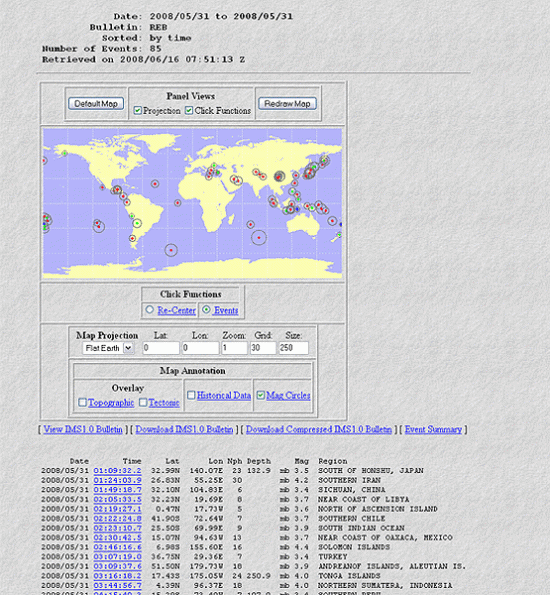
Example of Standard Event List SEL3.
Events listed in the Reviewed Event Bulletin have been examined by analysts.
Interactive analysis and the Reviewed Event Bulletin
The automatic processes to compile the Standard Event Lists from the original waveform data are quite sophisticated. However, it is still necessary for the results of automatic processing to be reviewed by an analyst to provide reliable and comprehensive information to Member States.
Sometimes signals may be associated with the wrong event. Occasionally, events are listed which are not real, and sometimes events are missed. Analysts at the IDC therefore review every single event listed in SEL3.
The analyst discards events which are not real, adds signals which have not been associated to an event, and corrects and improves the location estimates of those events which are real.
Analysts must also disentangle cases where the automatic processing has associated signals from two events together — a so-called mixed event — or where signals from one event have been interpreted automatically as two events — a so-called split event. They also scan the data for events which may have been missed entirely.
The role of the human analysts in the overall process is of crucial importance, carrying considerable responsibility. They must sift through all automatically generated event lists, carrying out an investigation based on scattered information and against tight deadlines. They need experience, good judgement and sharp detecting skills.
After interactive analysis, in which the IDC analyst has looked at all available information and assigned it correctly, the number of events meeting the required criteria for further attention is reduced approximately by half. The confirmed and corrected events are listed in a daily Reviewed Event Bulletin (REB), ready for the next stage of processing: automatic waveform event screening.
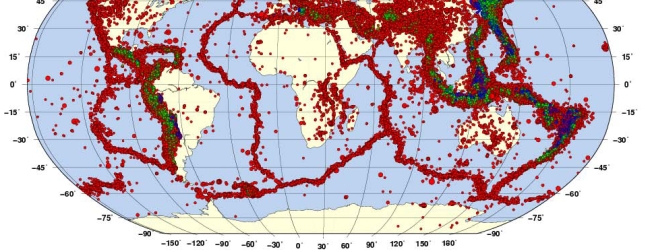
The map shows all events listed in Reviewed Event Bulletins from February 2000 to November 2010.
Automatic waveform event screening
The purpose of automatic waveform event screening is to look at specific characteristics of the events listed in the REB, in order to identify whether they are of natural or non-natural origin.
As most entries in the REB are seismic events, the values measured for the various seismic waves are of particular interest. There are different kinds of seismic waves: body waves that travel through the interior of the Earth, and surface waves that travel along its surface.
Each type of seismic event creates these seismic waves in a different and recognizable pattern. These patterns can provide information on the nature of an event - whether it is natural or the result of human action such as an explosion.
For example, for events occurring near a monitoring station, two different types of body waves are examined: P-waves and S-waves. An earthquake typically generates small P-waves and big S-waves. With an explosion the ratio is usually reversed – the P-waves are considerably larger than the S-waves. As these waves travel at different speeds — P-waves move faster than S-waves — an easy distinction between them can be made in the respective seismograms.
The comparison of seismograms from North Korea’s first nuclear test in 2006 and an earthquake in the same region in 2002 provides a good case study. The explosion’s seismogram, recorded at a seismic station in South Korea, shows large P-waves followed by considerably smaller S-waves. In contrast, the earthquake generated smaller P-waves and larger S-waves.
Other very important screening criteria are the magnitude ratios of body waves and surface waves. Measurements taken more than 2000 kilometres away from an event form the basis for the calculation of the body wave magnitudes. The magnitude ratio between body waves and surface waves is known to be comparatively larger for non-natural events such as explosions than for natural events.
Information on the depth of an event is also used as a criterion to distinguish between natural and non-natural events. Technology limits the depth at which an explosion can be detonated. Hence, great depths clearly disqualify an event from being of human origin.
Some events may have hydroacoustic data associated with them. Particular properties of hydroacoustic waves are examined to help identify an event as natural or non-natural.
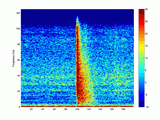
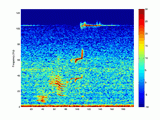
Sound waves in the ocean can be one of three types of signal: H-phase, T-phase or N-phase. H-phase signals come from in-water explosions caused either by human devices or underwater volcanic eruptions. T-phases are waves generated by distant earthquakes. They are formed when seabed vibrations caused by the earthquake send sound into the water. N-phase signals are noise signals from a wide range of physical sources such as iceberg-generated noise, airgun surveys by the oil and gas industry, and whale songs.
Following further analysis of their frequency properties, the association of T-phases serves to exclude an in-water explosive event during the event screening process, as these waves are considered to be generated exclusively by underground events.
Should the screening criteria indicate that the event is natural, it will be screened out. Only those events that were clearly identified as of human origin, or where screening did not provide clear answers, are kept and listed in a Standard Screened Event Bulletin (SSEB) as potentially suspicious events.
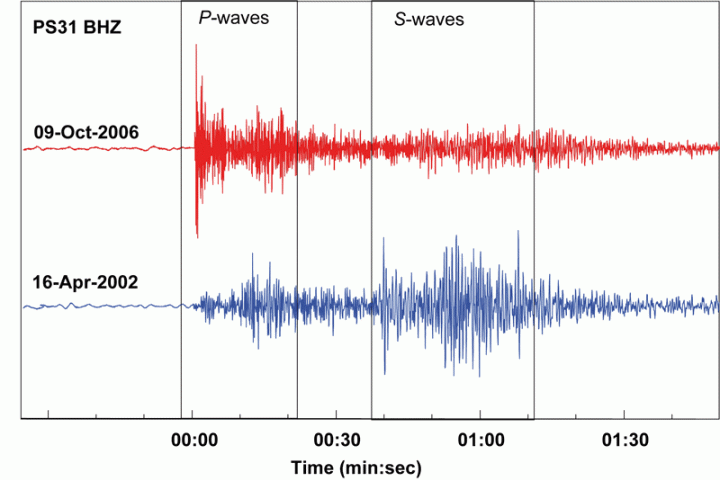
Seismograms of the announced nuclear explosion in the Democratic People's Republic of Korea in 2006 and of a nearby earthquake in 2002.
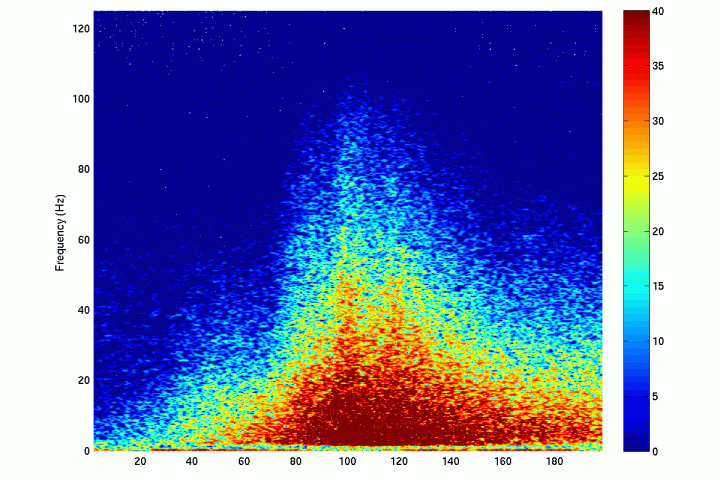
Example of a T-phase - spectrogram of an earthquake. Click image to listen.

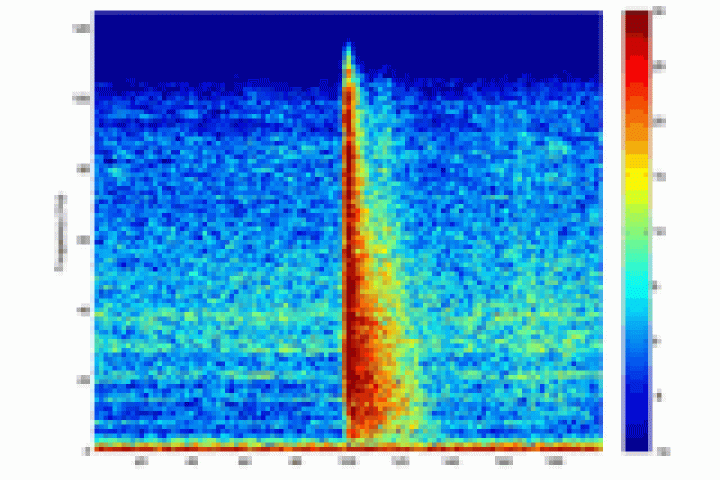
Example of an H-phase - spectrogram of an explosion. Click image to listen.

Example of a N-phase - spectrogram of whale song. Click image to listen.

Analysts review a number of different events each day.